The Page Felt Slow. React Wasn't the Bottleneck.
The delay appeared after a click in the UI, so React looked suspicious. But tracing the request backwards changed the problem completely: the expensive work was happening before React had anything to render.
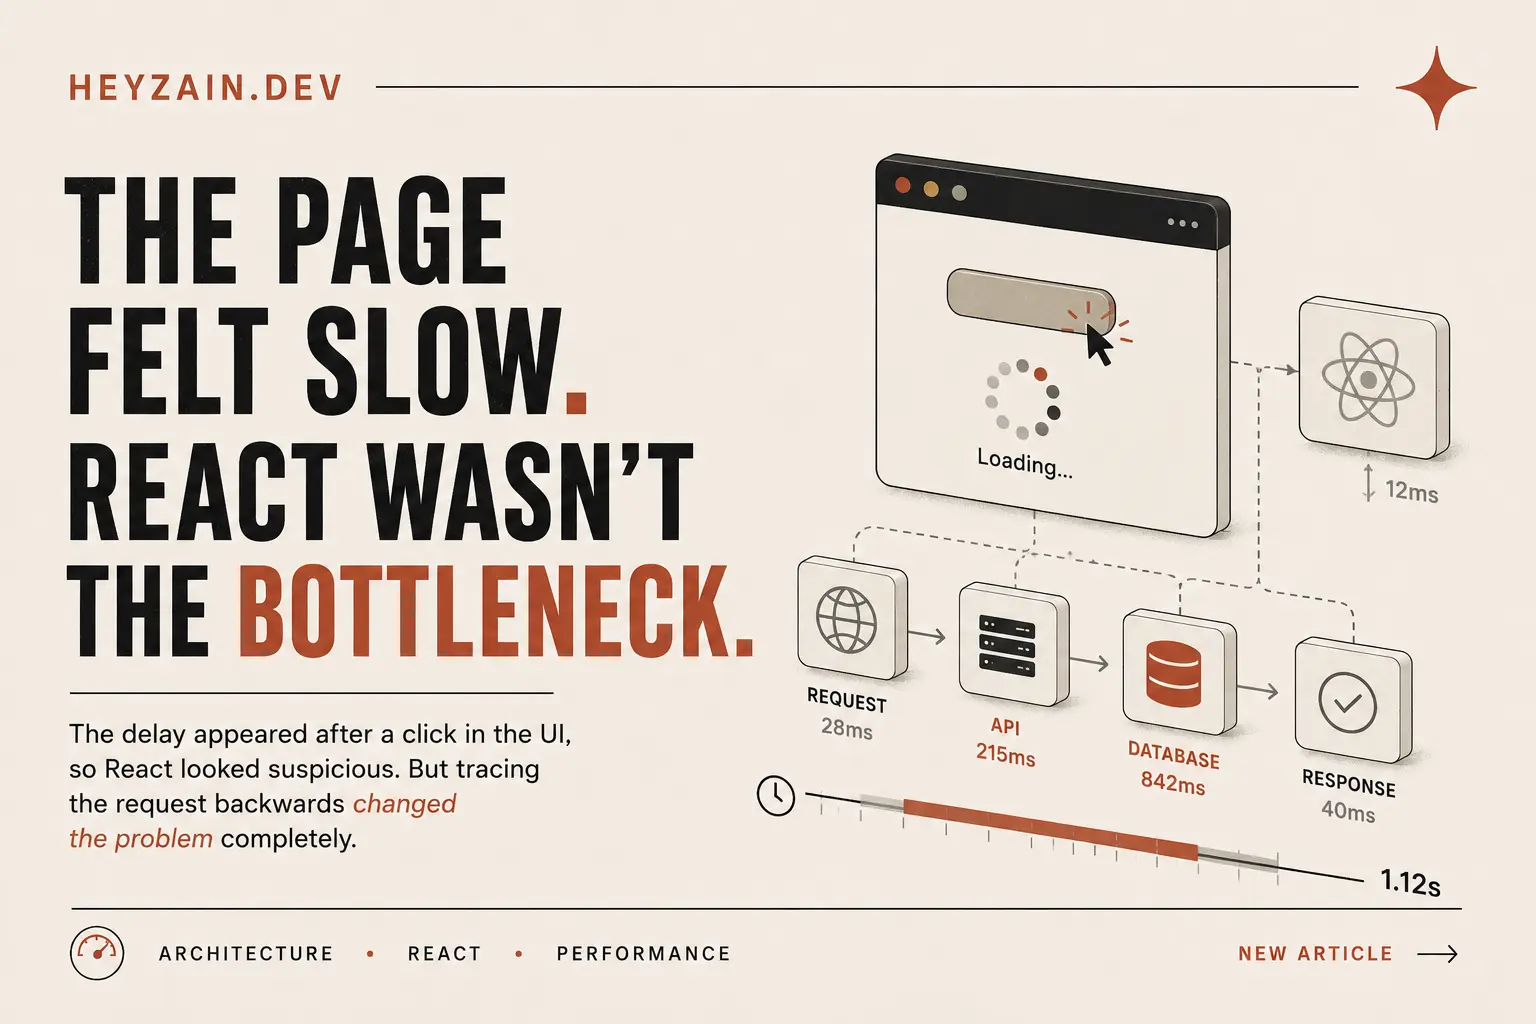
The Core Principle
A slow interaction is experienced in the frontend, but that does not make the frontend the cause. Trace the request backwards, measure each boundary, and optimize the layer actually consuming the time.
A user clicks a button.
The interface enters a loading state. Nothing happens for a moment. Then the result appears.
From the user's perspective, the page was slow. From the developer's perspective, it is tempting to translate that immediately into: the frontend is slow.
That translation is where debugging can go wrong.
We experience performance at the frontend, but we don't necessarily create the delay there. One interaction can cross the browser, API code, database, API response, and another render before the user sees the result. React might be responsible. But React might also have spent almost the entire interaction waiting.
Instead of asking why is this component slow?, I would rather start with where is this interaction spending its time?
Those sound similar. They lead to very different investigations.
A Slow Screen Gives You a Location, Not a Diagnosis
Suppose an interaction looks roughly like this:
User clicks
    |
React handler
    |
HTTP request
    |
API handler
    |
Database query
    |
API response
    |
State update
    |
React renders the result
The user experiences that entire sequence as one thing: “the page took too long.” React owns the visible beginning and end of the interaction, so it naturally becomes suspicious.
You open React DevTools. You check for unnecessary renders. You look at useMemo. You inspect component boundaries. Maybe you start moving state around. All of those techniques can matter. But there is a more fundamental question that should come first:
How much of the delay exists while React is actually doing work?
If the browser sends a request and waits over a second for a response, while the final React update takes a few milliseconds, reorganizing the component tree attacks the wrong part of the timeline.
[ click ]
   |
   | small client-side work
   v
[ request ------------------------------------- ]
                                                  |
                                                  v
                                             [ response ]
                                                  |
                                                  | render
                                                  v
                                               [ UI ]
A fast render cannot recover time that has already disappeared upstream.
Callout
Performance ownership follows elapsed work, not visual ownership. The frontend may own the loading spinner. It does not automatically own the wait.
Why the Frontend Gets Blamed First
There is a simple reason this mistake happens. The frontend is observable.
You can see the spinner. You can see the button. You can see the list arrive late. You can inspect the component producing those things. Database work is invisible unless you deliberately expose it through measurements.
That creates an observability bias: we start optimizing the part of the system we can see. The mistake is not investigating React. The mistake is investigating React before establishing that React owns meaningful latency.
A React application can have unnecessary renders, excessive JavaScript, slow hydration, expensive calculations, or poor state architecture, and still have a completely separate database problem. Full-stack latency is additive. Roughly:
Interaction latency
  ≈ client work
  + network
  + server work
  + database work
  + serialization
  + network
  + client processing
  + render
Not every request literally behaves this simply — some work overlaps, streaming changes the model, caching changes it again — but this approximation gives us a much better debugging question: which term is unexpectedly large?
Trace the Request Backwards
The most useful idea here is the debugging direction. Don't begin by rewriting. Begin by tracing — from the browser backwards: request duration, API execution, database query, then the query execution plan. Each measurement narrows the search space.
“The application feels slow”
↓
“This HTTP request is slow”
↓
“This API handler is slow”
↓
“This database operation dominates the handler”
↓
“This query is examining far more data than it returns”
That final statement is actionable. “The page feels slow” isn't.
Measure Boundaries Before Changing Implementations
The browser gives us a convenient first boundary. I would not treat this as sophisticated instrumentation — it simply answers whether we are waiting before the data reaches the component.
const startedAt = performance.now();

const response = await fetch("/api/projects");
const projects = await response.json();

console.log(
  `Request + parsing: ${performance.now() - startedAt}ms`
);
If the answer is yes, move one layer deeper. A simplified API handler can temporarily expose separate timings:
const requestStartedAt = performance.now();

const dbStartedAt = performance.now();

const projects = await db
  .collection("projects")
  .find({ ownerId })
  .toArray();

const dbDuration = performance.now() - dbStartedAt;

const requestDuration =
  performance.now() - requestStartedAt;

console.log({
  dbDuration,
  requestDuration,
});
If requestDuration is much larger than dbDuration, significant work exists elsewhere in the handler. If they are roughly equal, the database deserves much more attention. Without those measurements, both cases produce the same spinner.
A Database Can Return Little Data After Doing a Lot of Work
A query taking a long time tells us where the delay is. It does not yet explain why. MongoDB's execution stats fill that gap:
db.projects
  .find({
    ownerId: userId,
    status: "active",
  })
  .explain("executionStats");

// executionStats: {
//   nReturned: 20,
//   totalDocsExamined: 48213,
//   totalKeysExamined: 0,
//   executionTimeMillis: 340,
//   winningPlan: { stage: "COLLSCAN" }
// }
Getting 20 records back does not mean MongoDB only had to consider 20 records. The useful distinction is between what the application receives and what the database had to inspect to produce it.
DOCUMENTS EXAMINED VS. DOCUMENTS RETURNED
A small response does not imply a small amount of database work.
nReturned Tells Only Half the Story
nReturned answers: how many results satisfied the query? A small nReturned looks innocent. But combine it with totalDocsExamined, and the question becomes: how many documents did MongoDB inspect to find those results?
That ratio is often more informative than either number alone. It doesn't automatically mean “add an index.” But it gives you evidence that query access deserves investigation.
The performance problem is no longer React takes too long to display these records. It becomes the database is doing too much work to identify the records React needs. Those require completely different fixes.
totalKeysExamined Helps You Reason About the Index
An index doesn't make every query efficient just because one exists. You also need to ask whether the database is using an index that matches how the query actually filters and sorts data.
db.projects
  .find({
    ownerId: userId,
    status: "active",
  })
  .sort({ updatedAt: -1 })
  .limit(20);

// Access pattern: filter on ownerId + status, sort on updatedAt, limit 20
db.projects.createIndex({
  ownerId: 1,
  status: 1,
  updatedAt: -1,
});
Whether that exact index is correct depends on the application's data distribution, query workload, other read patterns, and write cost. The principle isn't every slow query needs a compound index. It is: design indexes around real access patterns, then verify the execution plan.
The Execution Plan Tells You What MongoDB Actually Decided to Do
Code shows what we asked for. The execution plan shows how the database tried to satisfy it.
COLLSCAN
MongoDB is scanning documents in the collection. Not automatically wrong — a small collection can be scanned cheaply.
IXSCAN
Index traversal is involved. Not automatically good — an index can still examine far more keys than expected, or help reads while making writes more expensive.
This is why I prefer execution evidence over rules like “slow MongoDB? Add an index.” The real sequence is:
Before
slow
-> add optimization
-> hope
After
observe -> measure
-> inspect -> understand
-> change -> measure again
Query Design Is Application Architecture
Database performance is sometimes treated as something that happens after the application has already been designed: build the UI, build the API, create the schemas, then add indexes if something gets slow. I think that model is incomplete.
Queries express the way the product retrieves information. If a screen needs records belonging to one user, in a particular state, ordered by recent activity, twenty at a time — that access pattern is part of the screen's architecture whether we acknowledge it or not.
Product interaction
       |
Data shape needed by UI
       |
API contract
       |
Query shape
       |
Index / storage strategy
This is one reason full-stack performance problems often resist layer-by-layer thinking. The layers are separate in implementation. They are connected in latency.
I tackled these compound index and execution plan bottlenecks directly when engineering the multi-vendor transaction pipelines for DentalBox, ensuring multi-supplier checkouts maintain strict ledger consistency without latency spikes.
Faster Queries Aren't Always About Indexes Either
Once you establish that a database operation is expensive, indexing becomes one possibility — not the automatic answer.
Return only what the interaction needs
If a listing screen only needs a few fields, there may be no reason to retrieve large fields used only by a detail screen.
db.projects.find(
  { ownerId: userId },
  {
    projection: {
      name: 1,
      status: 1,
      updatedAt: 1,
    },
  }
);
That doesn't solve every query-performance issue, but it can reduce data transfer and downstream processing.
Avoid accidentally unbounded reads
.find({ ownerId }).toArray() has very different scaling behavior from a deliberately paginated query. What feels harmless with tens of records can become a different request entirely as the dataset grows.
Treat sorting as part of the query
Filtering and sorting aren't two unrelated operations from the database's perspective. If a common request filters one way and sorts another, the complete access pattern should inform the index strategy.
Question repeated queries
Sometimes the individual query isn't catastrophically slow. The request is slow because the handler performs it repeatedly.
query A
   |
query B
   |
query C
   |
query D
This can create latency even when each step looks reasonable by itself. At that point the issue moves from individual query speed toward API and data-access architecture.
The Actual Optimization Target
The useful before/after comparison isn't wrapping a component in memo(). That may change nothing about the experience. The more meaningful structural comparison looks like this:
Before
Click
↓ Fast frontend
↓ API
↓ Expensive database work
↓ Response
↓ Fast render
Result: still feels slow
After
Click
↓ Fast frontend
↓ API
↓ Query aligned with access pattern
↓ Response
↓ Fast render
Result: less waiting in the request path
The improvement didn't come from making React cleverer. It came from removing work from the layer that was actually consuming the interaction budget.
There Is Another Trap: Stopping After the Database Fix
Suppose you find an inefficient query. You change the query or index. The execution plan looks healthier. Done? Not quite.
The original symptom was not my MongoDB execution stats look bad. It was this interaction feels slow. So the final measurement has to return to the original interaction.
Reproduce the slow interaction
Trigger the exact click, load, or navigation the user experienced — not a synthetic approximation of it.
Measure the browser request
Time the fetch from the client. Establish whether the wait is even inside the request/response cycle.
Measure the API handler
Time the server function itself to see how much of the request duration it accounts for.
Time the database operation
Isolate the query or queries inside the handler from the rest of the handler's logic.
Inspect the execution plan
Run explain("executionStats") and read nReturned, totalDocsExamined, and the winning plan.
Change the actual bottleneck
Adjust the query, index, projection, or access pattern the evidence points to — not the first layer you can see.
Retest the same interaction
Reproduce the original click again. Confirm the user-facing symptom improved, not just a metric.
That final step is more important than it looks. Optimization should close the loop: you need to prove that changing the subsystem improved the thing the user experienced. Otherwise you have optimized a metric, not necessarily the product.
A Better Debugging Model: Narrow the Latency Boundary
When an interaction is slow, the most useful first task is reducing the size of the unknown system.
APPLICATION
  \-- REQUEST
       \-- API
            \-- DATABASE
                 \-- QUERY PLAN
Every measurement shrinks the uncertainty. That is much more effective than changing code across several layers and seeing whether the application “feels faster.” Performance debugging becomes less mysterious when it becomes an isolation problem.
When a Page Feels Slow: The Decision Path
Before touching the implementation, walk through this:
Is the UI itself doing expensive work?
Profile rendering, JS, state, and hydration.
Is the request slow?
If not, inspect client work around the request instead.
Is the API handler slow?
If not, investigate network transfer, not the database.
Is database time dominant?
If not, inspect server logic outside the query.
Inspect the query execution plan
Change the query, index, or data access — then retest the interaction.
The individual tools can change. The reasoning should not.
React Wasn't Innocent. It Just Wasn't Guilty Yet.
None of this means frontend performance work is unimportant. A page can absolutely be slow because React is doing too much. A large render tree can be expensive. Poor state boundaries can trigger unnecessary work. Hydration can delay interaction.
The mistake is jumping from “I see the delay in React” to “React caused the delay.”
A slow page is a symptom, not a diagnosis. I would extend that slightly: a slow page tells you where the user noticed the problem. Instrumentation tells you where the system created it. Those are not always the same place. And that difference is where useful performance debugging begins.
The Takeaway
Measure the request from the symptom backwards.
A slow page is evidence that something in the interaction path is slow — not evidence that the frontend is responsible. Narrow the boundary until you can name the work consuming the time, then optimize that work and retest the original interaction.
Frequently Asked Questions
How do I know whether React or the backend is making a page slow?
Start by separating render time from request time. If the browser spends most of the interaction waiting for an API response, frontend rendering is unlikely to explain that portion of the delay. Measure the API handler next, then continue deeper until the dominant work is isolated.
Does a slow MongoDB query always mean I need another index?
No. An index is one possible solution. First inspect the query's execution plan and access pattern. The problem may involve an unsuitable index, excessive documents examined, unnecessary fields, unbounded results, sorting, repeated queries, or API-level query waterfalls.
What does totalDocsExamined mean in MongoDB?
It indicates how many documents MongoDB examined while executing the query. Comparing it with nReturned can help reveal cases where the database inspects much more data than the application ultimately receives.
Is IXSCAN always better than COLLSCAN?
No. An index scan only tells you that an index is involved. You still need to examine the amount of work performed and consider the size and shape of the data. Collection scans can also be perfectly reasonable for very small collections or particular workloads.
Should I optimize React after fixing the database query?
Only if measurements show there is still meaningful frontend work to remove. Database optimization and React optimization solve different parts of the request lifecycle. Retest the complete interaction after every meaningful change.
What should I measure first when a page feels slow?
Measure the user-visible interaction first, then divide it at system boundaries: browser request, server handler, database operation, and query execution. The goal is to find where elapsed time accumulates before changing code.
HeyZain is the engineering portfolio and technical publication of Zain Ali, a full-stack developer and software engineer specializing in Next.js, React, Node.js, TypeScript, and MongoDB. He builds production-ready web platforms, SaaS products, marketplaces, and developer tools from schema design to edge deployment.